This study examines the determinants of 2013 to 2019 residential property sale prices in Cook County, Illinois using a three-stage linear modeling approach. Beginning with a simple univariate model based on bedroom count, I iteratively introduce building size and then a comprehensive set of engineered features (including log-transformed area measures, tax assessor estimates, fireplace counts, repair condition scores, central air conditioning status, and categorical encodings of room counts). My final model trained on 204,792 property transactions achieves a root-mean-square error (RMSE) of 0.3716 in predicting log sale price, representing a substantial 57% improvement over the baseline. I also find that lower-priced homes are systematically overestimated, illustrating a regressive bias that can exacerbate tax burdens on low-income residents. Drawing from local journalism and policy research, I discuss how tax appeal processes, neighborhood demographics, and historical segregation intersect with model performance to compound unfair outcomes.
Accurate prediction of residential sale prices is crucial for market transparency, equitable property taxation, and urban planning. While hedonic price models have long incorporated structural and locational attributes, advances in data pipelines and feature engineering now allow for larger-scale, reproducible analyses. This paper details a structured approach to modeling Cook County sale prices, emphasizing clarity, reproducibility, and interpretability. I additionally interrogate how residual errors map onto price strata, revealing a regressive pattern that aligns with critiques of Cook County’s assessment practices.
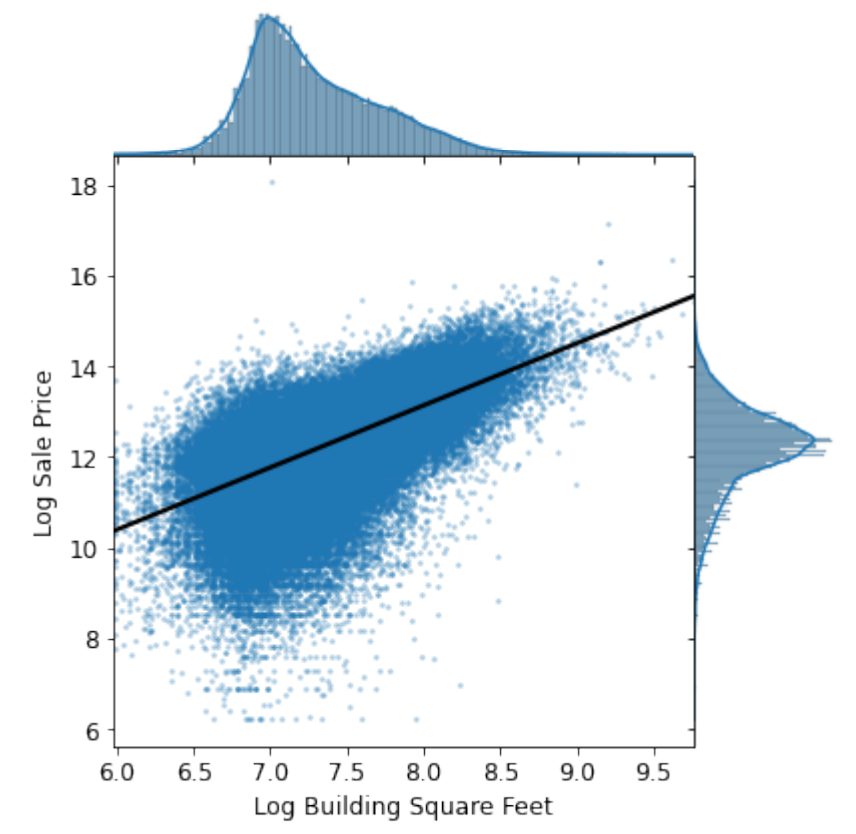
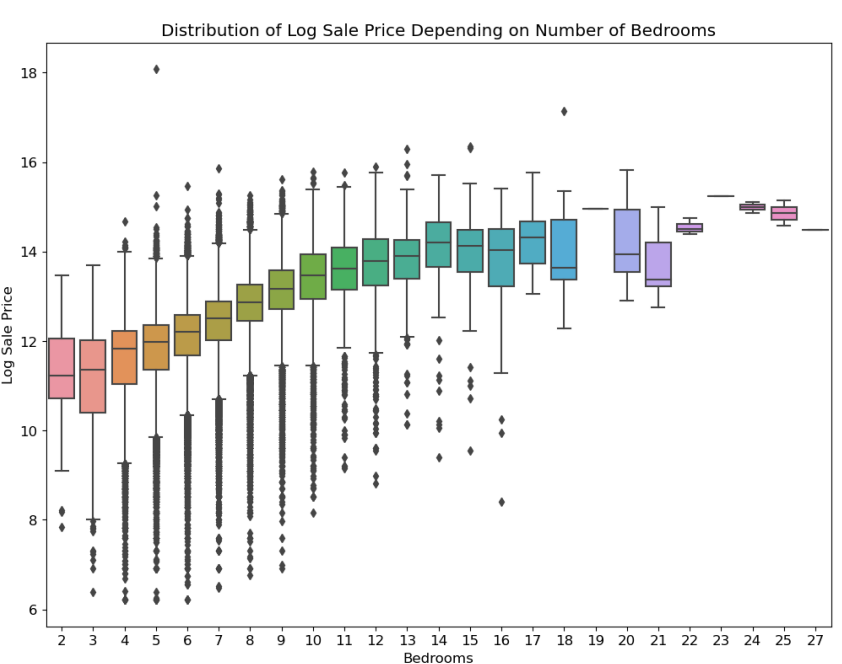
The primary dataset (cook_county_train.csv) contains 204,792 records and 62 features, including physical attributes (e.g., building square footage, number of bedrooms), material characteristics (e.g., roof and wall types), condition assessments, and tax assessor estimates for land and building values. A companion codebook (data/codebook.txt) describes each variable.
| Model | Engineered Feature(s) | RMSE (multiplier error) |
|---|---|---|
| Model 1 (Baseline) | Bedrooms | 0.8674 (~×2.38 error) |
| Model 2 (Intermediate) | Bedrooms + Log Area | 0.8059 (~×2.24 error) |
| Model 3 (Final) | 13 Predictors | 0.3716 (~×1.45 error) |
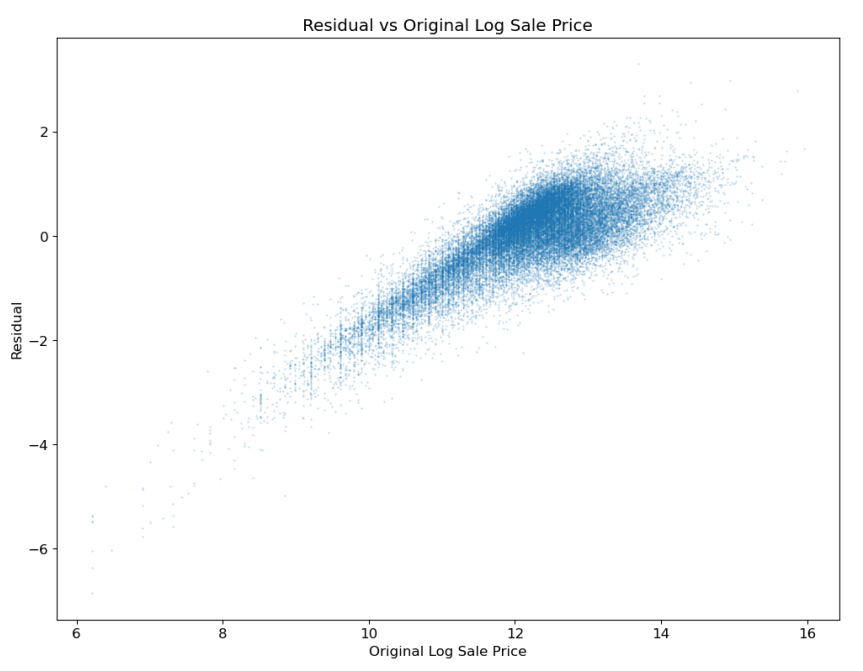
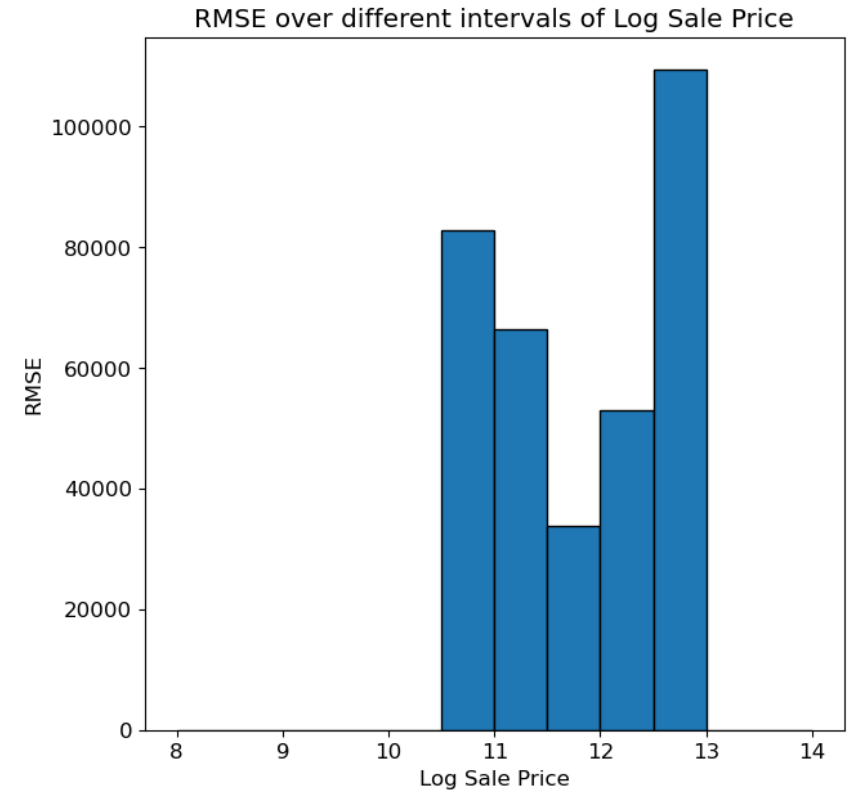
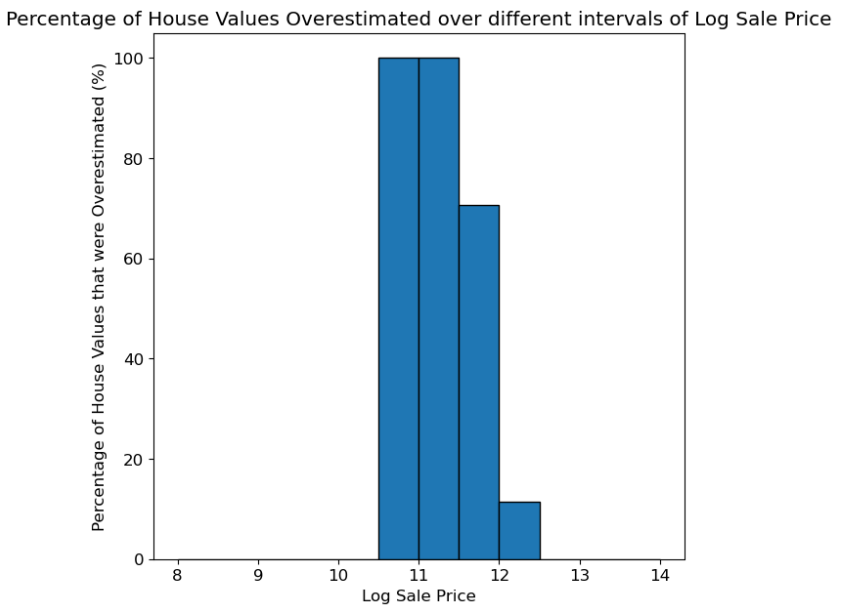
This analysis demonstrates that a reproducible hedonic modeling workflow cuts RMSE from 0.87 to 0.37 and uncovers a regressive taxation bias in Cook County, Illinois. There exists a systematic overestimation of lower-priced homes, intensifying price burdens for their owners.
Even accurate models can reinforce systemic inequity if their errors fall disproportionately on disadvantaged groups. Predictive models must go beyond technical accuracy to incorporate fairness, transparency, and local context. Without thoughtful oversight, even the most statistically sound models risk amplifying racial and economic disparities. Future work should integrate fairness metrics and spatial controls to ensure more equitable assessment outcomes.